
Chart Reading & Price Action: See Structure Before Signals
Core concepts
Price action is the study of what price has done: where it moved, paused, rejected, and broke. A candlestick shows open, high, low, and close for one period. Its body shows open-to-close movement and its wicks show prices reached but not held. A candle pattern gains meaning from its location and context, not from its name alone.
How it works in practice
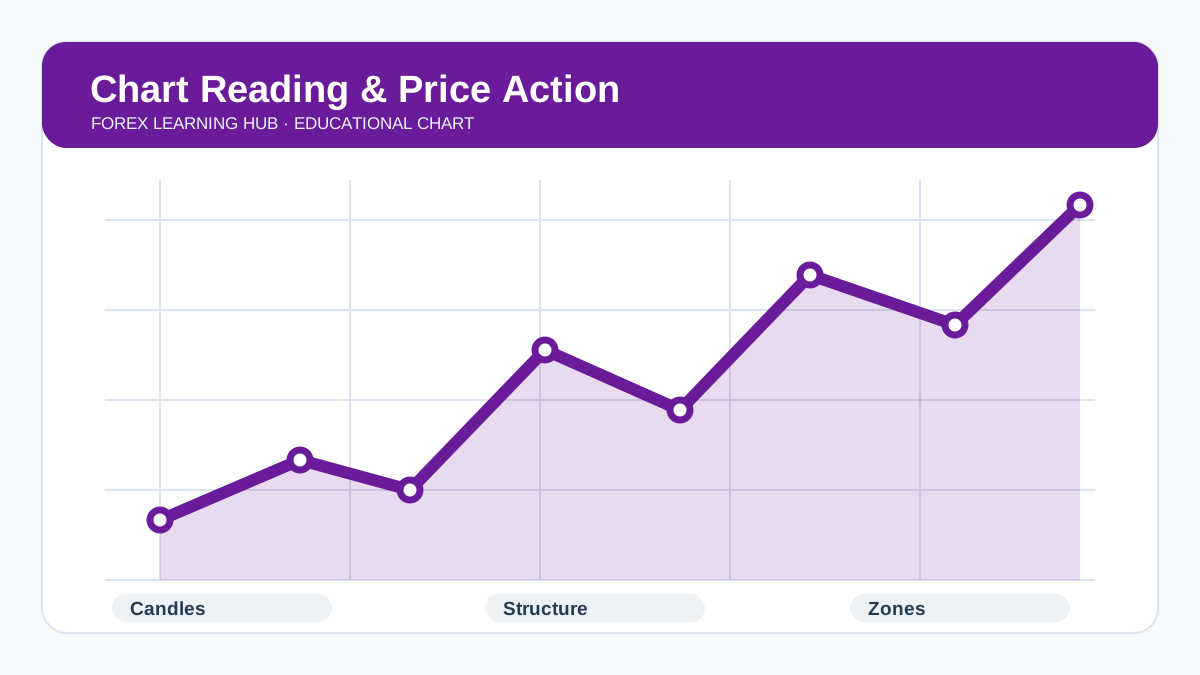
Market structure gives the chart a map. An uptrend commonly produces higher highs and higher lows; a downtrend commonly produces lower lows and lower highs. Mark obvious swings, not every tiny movement. Support and resistance are areas where price reacted before, so draw zones rather than pretending one exact line will always hold.
Rules and risk
Use three timeframes with distinct jobs: higher timeframe for context, middle timeframe for the setup area, and lower timeframe for timing. A daily trend, four-hour pullback, and one-hour entry pattern is one useful swing-trading combination. When timeframes conflict, reduced size or no trade is often better than inventing certainty.
Example
Example: GBP/USD makes higher highs and higher lows on the daily chart, returns to a former breakout zone on four-hour, then breaks a small lower high on one-hour. A stop belongs below the point that invalidates that retest, not at an arbitrary number of pips. If price closes decisively through the zone, the long idea is invalid.
Practical framework for Chart Reading & Price Action: See Structure Before Signals
Start by turning the concept into a written rule. Name the market and timeframe, define the condition that qualifies, identify the price or evidence that invalidates it, and state the maximum cash risk. A rule that cannot be checked before an order is sent cannot be audited afterward. This is why screenshots, platform reports, and a simple journal are more useful than memory.
A real-world workflow begins with preparation, not clicking. Check scheduled economic events, spreads and market hours, then decide whether conditions match the plan. If they do, calculate size from the stop distance and account risk. If they do not, do nothing. “No trade” is an outcome that protects both capital and data quality.
Worked decision process
Imagine you have a $2,000 account and a 0.5% risk rule. The maximum planned loss is $10. You find an idea that needs a 25-pip stop. Rather than selecting a favourite lot size, choose a position whose 25-pip loss, after reasonable cost allowance, stays near $10. If available sizing cannot achieve that safely, skip it or use a different account structure. The same discipline applies whether the idea is manual or automated.
Build evidence before confidence
The correct question after a trade is not “Was I right?” but “Did I follow a rule that has been tested?” A favourable result can come from a poor process, while a correctly executed trade can lose. Separate process metrics from financial results. Track rule adherence, time of day, market regime, costs, and whether the stop or target was changed. Review enough examples to include quiet markets, volatile markets, and losing streaks.
When testing, protect against hindsight. Hide future candles where possible, make the decision at the candle close specified by the rule, and record it before revealing the next section of chart. Use the same assumptions for every sample. If you revise a rule, label it as a new version and begin a new sample. This simple discipline prevents a chart review from quietly becoming a search for only the examples that work.
Execution standards
Write a short pre-trade note: market condition, reason for entry, invalidation, target logic, risk amount, and relevant scheduled event. During the trade, do not add rules that were absent at entry. After the trade, take a screenshot and record actual fill, costs, and outcome. A weekly review should identify one execution habit to retain and one to improve; it should not trigger wholesale strategy changes after a handful of results.
Common failure modes
The most common failure is changing a rule after a trade is open. Other failures include ignoring execution costs, entering during unsuitable news volatility, treating a backtest as a promise, and measuring success only by the latest profit. Replace these habits with a pre-trade checklist, a daily loss limit, and a weekly review of process adherence.
Actionable next step
Collect twenty historical examples before risking money. For each one, record market condition, entry trigger, stop, target, position size, costs, and result in R. Then review what happened during losses. If the rule remains coherent after ordinary losing trades, it is ready for more demo testing—not automatically for larger capital.
Reader exercise for Chart Reading & Price Action: See Structure Before Signals
Open a chart replay or historical chart for one major pair. Select a date at random and write a one-page plan using this article’s concepts before revealing the following candles. Include the higher-timeframe condition, relevant level or input, entry trigger, invalidation, target logic, risk amount, and reason to stay out. Then reveal twenty candles and compare the plan with what occurred. Repeat this exercise on ten different dates. The goal is not to find ten winners; it is to discover whether your rules produce decisions that are specific, consistent, and realistically executable.
Next, run the same exercise around a known high-impact event and a quieter session. Notice changes in spread, candle size, and the distance required for a logical stop. This comparison teaches a crucial lesson: a method must be sized for the market environment, not for a preferred outcome. Keep the worksheet with your journal, because it becomes evidence of progress when live emotions later complicate decisions.
Key takeaways
- Use this concept to make a rule clearer, not to create certainty.
- Define invalidation and cash risk before every order.
- Test on historical charts and demo conditions before using real money.
- Include spread, commission, financing, and slippage in every review.
Educational disclaimer: This is general education, not personal investment advice. Forex is leveraged and can lead to rapid losses. Use a properly authorised provider where you live and risk only money you can afford to lose.
Previous lessons: Forex Fundamentals: How the Currency Market Works
Trading Platforms & Tools: A Safe MetaTrader Starter Guide
Next lesson : Technical Analysis: How to Use Forex Indicators Responsibly